


The Global Consumer Insights Pulse Survey: India perspective highlights why companies need to connect with consumers very early in the purchasing process and address their point of decision.

- Around 5 in 10 India consumers almost always or frequently use their smartphone in-store for price comparison or to view live product reviews via social media before they make a purchase.
- For 5 in 10 India consumers, e-commerce websites and search engines are the top sources of pre-purchase information, while 3 in 10 check in with their family, friends and colleagues before deciding on a purchase.
- For nearly 4 out of 10 India consumers, traditional TV and sponsored social media advertisements influence a purchase decision.
These are among the key findings from the June 2023 Global Consumer Insights Pulse Survey: India perspective which amplifies the voice of the consumer, calling out factors that influence the point of decision in the consumer’s pre-purchase journey.
While the February 2023 Global Consumer Insights Pulse Survey1 showed the way for brands to reduce friction at the point of sale (PoS), this report focuses on ways of reaching the consumer prior to a purchase being made, at the point of decision making. It provides insights into consumer behaviour patterns and, based on the findings, outlines how to address the consumer’s requirements and expectations at crucial points of decision.
The findings indicate that:
- e-commerce websites and search engine optimisation are key to targeting and influencing pre-purchase behaviour
- smartphones catalyse smart shopping by consumers
- traditional TV ads and sponsored social media ads play a pivotal role in shaping consumer actions.
As consumers increasingly turn to the internet to research products before buying them, businesses now need to manage the pre-purchase consumer experience. By investing in search engine optimisation techniques, retailers can ensure their products are visible and drive organic traffic. Market leaders also need to prioritise online presence to adapt to changing consumer expectations. They should leverage emerging technologies such as the metaverse and generative artificial intelligence (AI) in customer relationship management (CRM) and meet consumer expectations on environmental, social and corporate governance (ESG) issues and sustainability. Millennials and Gen Z, who typically espouse social consciousness and environmental justice, were the most open to spending more for the sake of sustainability.

Key findings on consumer preferences
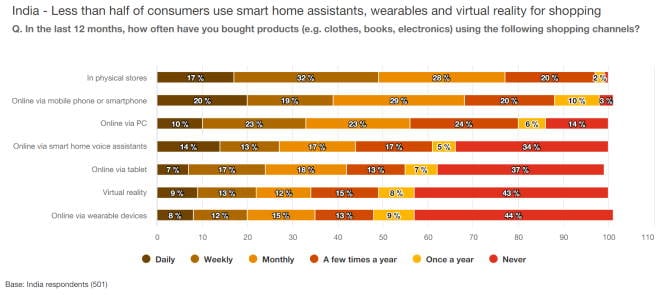
- In-store retail experience trumps online shopping: Consumers are not willing to trade the experience of in-store shopping for online shopping, convenient as it may be. Both globally and in India, people prefer to shop at physical stores.
- In the last 12 months, 49% of consumers in India and 41% of consumers globally preferred to shop for items such as clothes, books and electronics from a physical store.
- About 39% of Indians used their smartphones, as opposed to 33% globally, while 33% used their PC to shop in India and 23% used it globally.
Base: All respondents (8,975)
Base: India respondents (501) .


- Connected lifestyle technologies are gaining traction: Smart home voice assistants and wearable devices are also slowly growing as preferred channels for shopping.
- 14% of consumers in India used voice assistants daily to place orders, 13% used them weekly, and 17% used them monthly.
- About 9% of India consumers used virtual reality daily to shop as against 4% globally, 13% used it weekly as against 7% globally, and 12% used it monthly as against 8% globally.
- Wearable devices are also being used to shop, with 8% of India users as against 4% globally admitting to having used them daily in the last 12 months. Further, 12% as against 7% globally and 15% as against 9% globally said they used them weekly and monthly respectively.

Base: All respondents (8,975)
Base: India respondents (501)
- Consumers are vying to be the first to embrace cutting-edge tech: When it comes to technology, consumers want to be early adopters. Businesses that cater to early tech adopters can build a competitive advantage.
- About 31% of India consumers – 19% globally – want the latest cutting-edge technology as soon as it is available.
- Indian consumers want to outdo their peers, with 32% wanting to try out or own the latest technology before most people. Globally, the number stands at 29%.
- About 30% of global consumers are conservative about investing in the latest technology and only buy or try it out when it becomes more widely used. In contrast, 25% of Indians want to play it safe and prefer to interact with the latest technology at later stages.
- Metaverse adoption is growing globally: Early adoption of the metaverse is strong. Globally, 34% of consumers have interacted with the metaverse in the last six months. In our February 2023 survey,2 26% of respondents globally had reported using the metaverse for entertainment, virtual experiences or purchasing products in 2022. India consumers are more upbeat than their counterparts about the metaverse and its potential, with 51% of them engaging in metaverse-related activities in the last six months. Their engagement rates with the technology surpass global averages.
- Only 9% of consumers globally have accessed virtual online healthcare in the last six months compared to 15% in India, while 8% globally have joined a virtual world (to experience a retail environment, a concert, etc.) as opposed to 14% of Indian consumers.
As consumer spending declines globally due to inflation, businesses are grappling with softening demand. Learning how to navigate the pre-purchase stage can have a direct impact on the scale and cost of customer acquisition.

Decision point: Where do consumers begin their pre-purchase search?
It is common for today’s tech-savvy consumers to consult multiple sources for information on a desired product, recheck it on trusted forums, and form their opinion simultaneously as they go about loading their shopping cart. An interesting aspect of this journey is that evaluation happens as a continued process, starting at the first point of search and finishing at checkout.
E-commerce websites and search engines are top sources of information
Search engines and retailer websites are the top sources of pre-purchase information globally, with 54% of consumers relying on search engines to derive product information and 55%, on retailer websites. In India, however, a large e-commerce company is the go-to source for product information, with a whopping 60% of Indian consumers – as opposed to 35% globally – relying on its website. Search engines are among the top primary sources of information for Indians, with 50% looking up a product on a search engine before buying. But retailer websites figure low on the list, with only 21% of Indians frequenting them before making a purchase decision and another 28% using them to read product reviews.
Often, the buyer is not making the decision alone. At least 30% of buyers in India, and the same percentage globally, seek the opinion of friends, family and colleagues before making a purchase. Businesses can capitalise on this word-of-mouth influence by motivating customers to share positive reviews and testimonials. Social media platforms also shape consumer decisions, with 29% of consumers in India and 31% globally using social media to research a product before purchase.
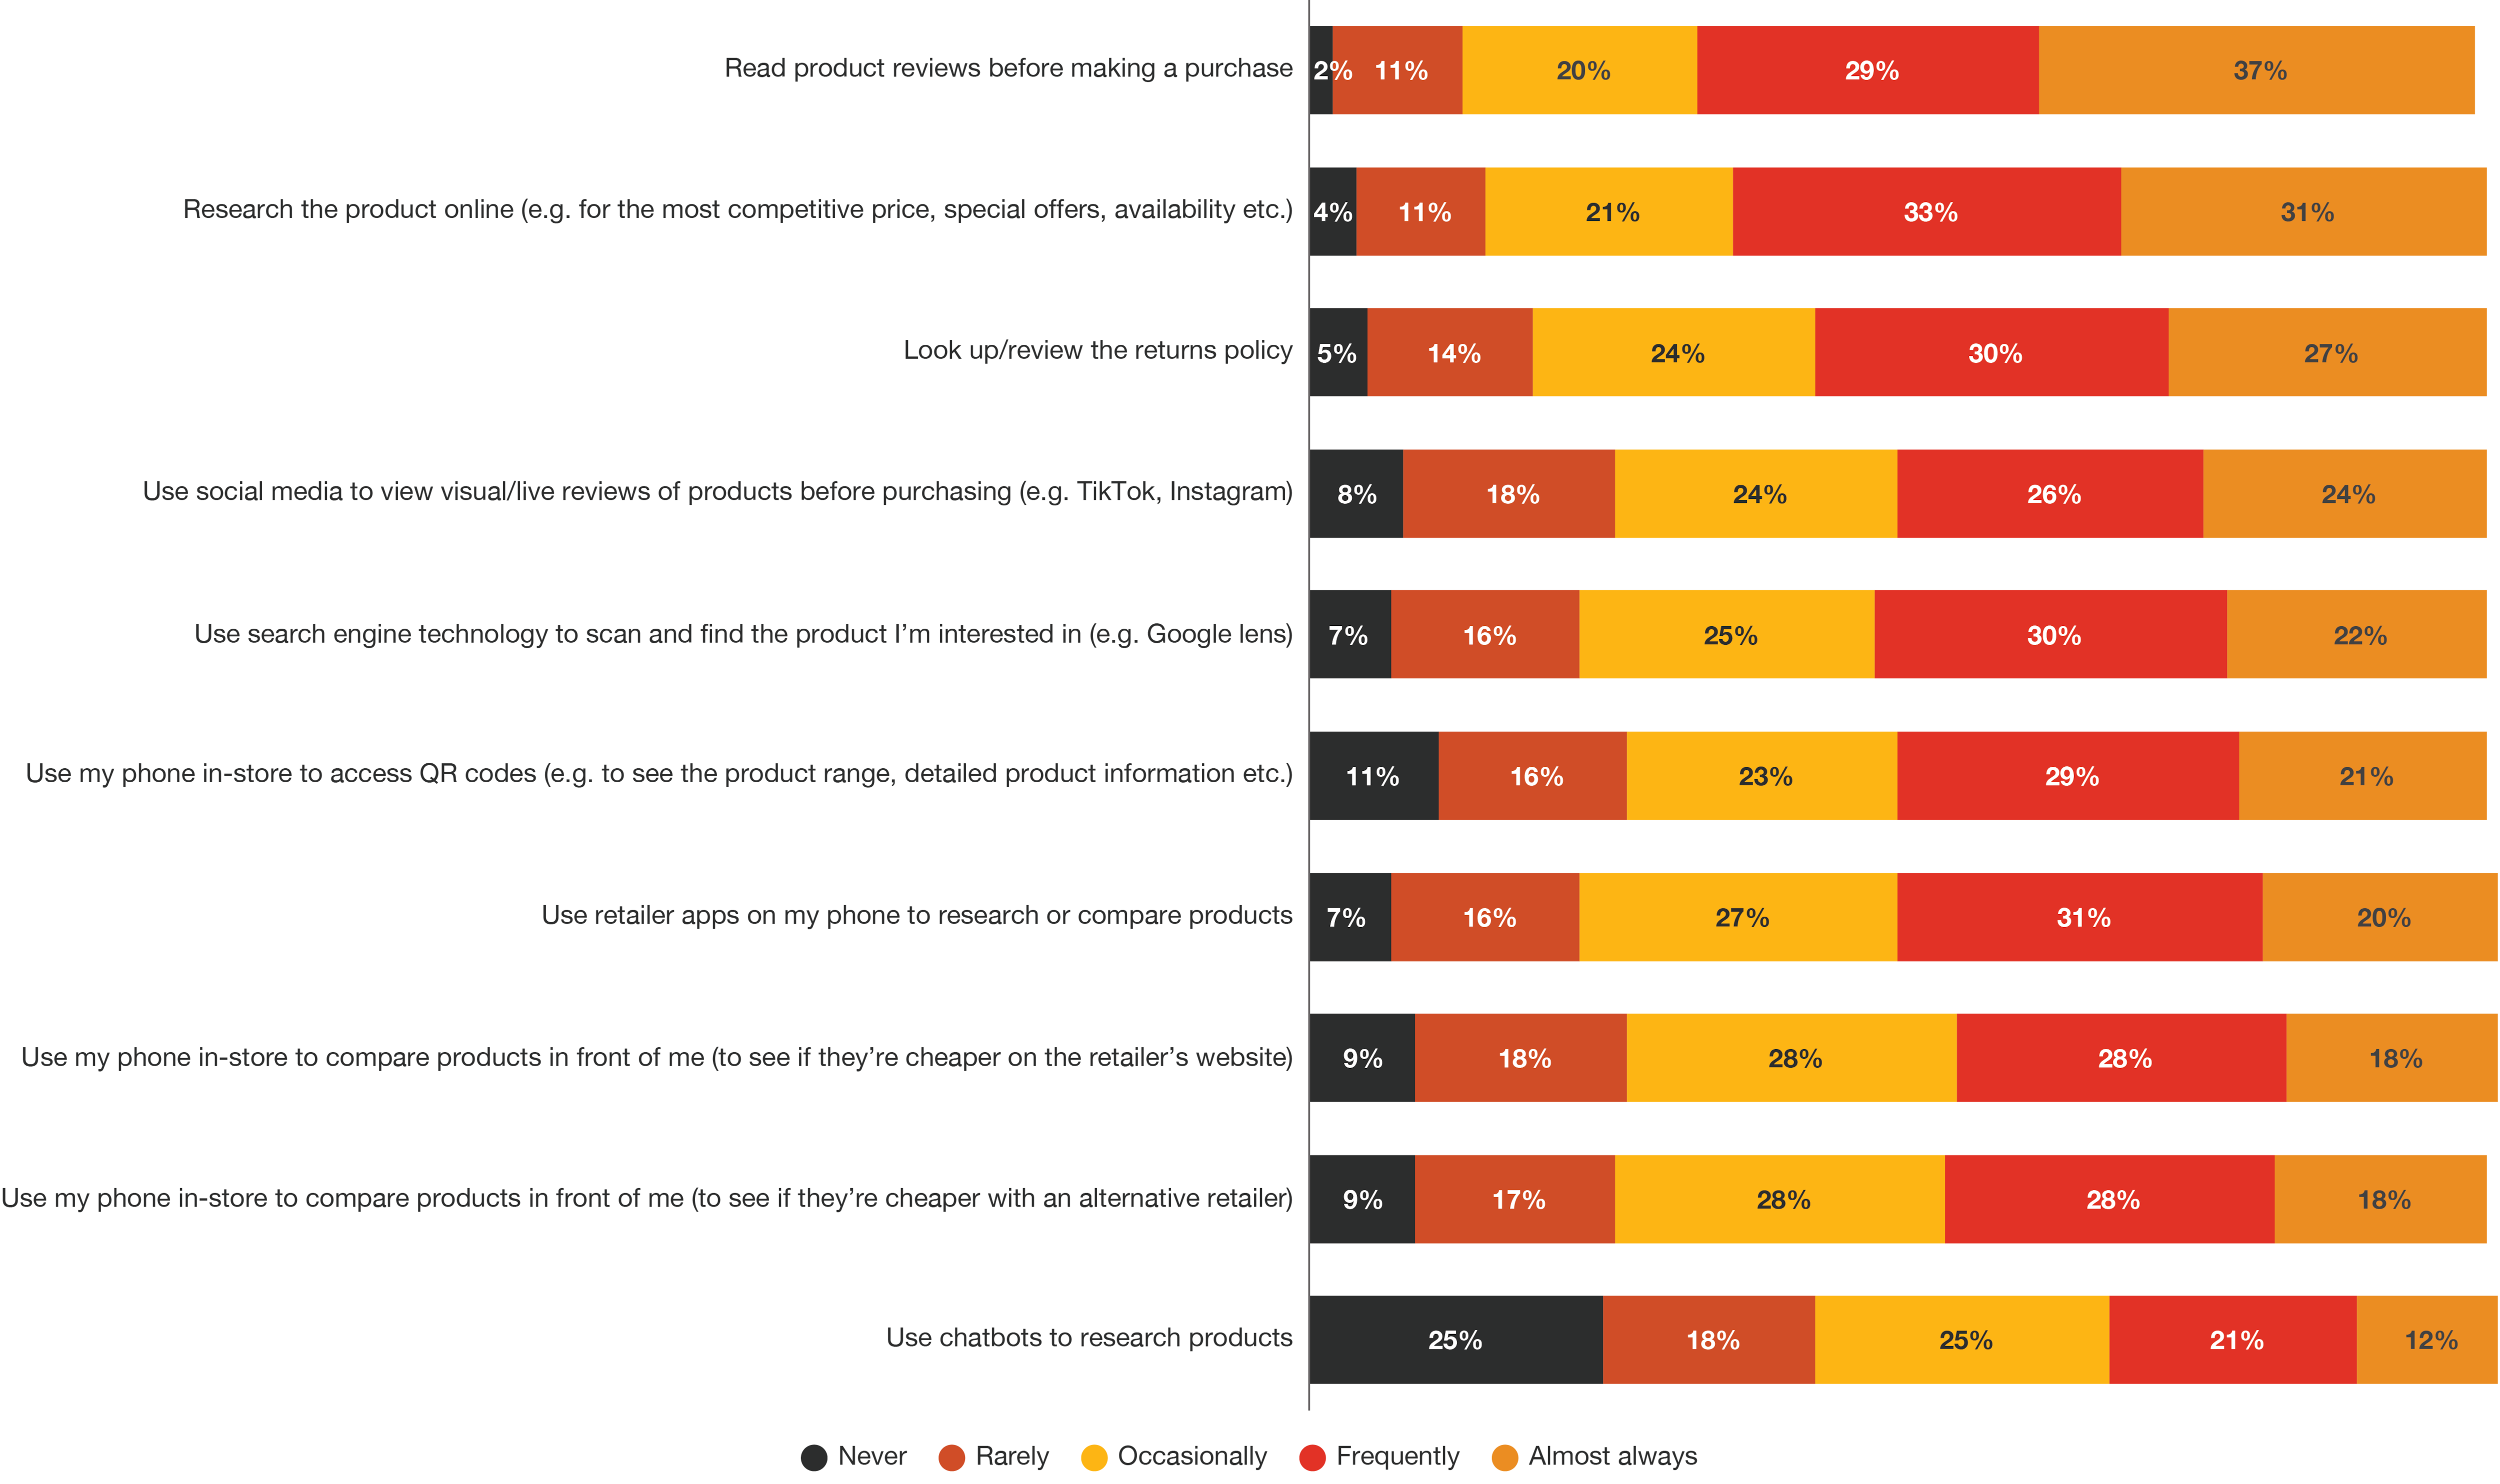
Smartphones empower consumers to take smart decisions
Around 66% of consumers in India – much higher than the global figure of 56% – almost always or frequently use their smartphone to research a product online for competitive prices, special offers and availability. While 65% of India consumers use their device almost always or frequently to read product reviews before making a purchase, 54% do so globally. India buyers are concerned about the returns policy, with 57% of them using their smartphones to educate themselves on it, while globally only 33% look up the returns policy. About 50% of India consumers – 40% globally – use retailer apps on their phone to research or compare products.

Base: India respondents (501)
India consumers are far ahead of their global peers in taking tech-enabled decisions for better bargains. A staggering 52% of India consumers, compared with 38% globally, use search engine technology to scan and find a product they are interested in. While 51% of consumers in India use social media to check out visuals or live reviews before making a purchase, the global percentage is only 37%. India consumers are more willing to engage with chatbots, with 33% using them to research products as opposed to just 16% globally.
Businesses are likely to get better conversion rates by deploying AI-powered chatbots to assist consumers on their product research journey. In India’s mobile-first market, smartphone-enabled pre-purchase decision making is likely to grow more as internet access and smartphone ownership increases. By 2027, smartphone ownership in India is forecast to grow to 888 million.3
Base: India respondents (501)
Traditional TV ads and sponsored ads on social media influence the pre-purchase stage the most in India
While global consumers said direct promotional advertisements were the most influential in making a purchase decision, India consumers still lean towards traditional TV ads. About 40% said TV ads influenced their purchase decision compared with 35% globally. India’s TV advertising market has recovered rapidly from the COVID-19 pandemic downturn, with revenue expanding 11.9% in 2022 to reach USD 4.7 billion.4 TV ad spend is projected to reach USD 6.5 billion in 2027. By this time, India will be the fourth-largest TV advertising market globally, after the US, Japan and China. The market’s expansion continues to be based on economic development and an increasing proportion of households having television sets.
Apart from TV ads, sponsored ads on social media are an important factor influencing buying decisions both at a global level (34%) and in India (38%). Traditional TV ads and sponsored social media ads remain in strong competition with product placement in movies, TV programmes and other media for influencing purchase. Personalised ads via email ranked low, with only 15% of India consumers saying they had any effect on their purchase decision. A significant proportion of buyers in India – 31% – said they were influenced by ads featuring famous celebrities or influencers. The content creator economy is thriving in India. For instance, the top 306 creator accounts had more than 10 million followers across just three platforms, as of September 2022.5
Metaverse and generative AI are set to redefine the buying experiences
With the metaverse and generative AI, the boundaries of physical and digital shopping are set to get blurred. According to the survey, about 44% of consumers globally and 53% in India are interested in interacting with generative AI to search for product information before they make purchase decisions.
The metaverse promises a frictionless shopping experience, but a world where an avatar does one’s shopping virtually will take time to unfold. Still, awareness about the metaverse is growing. Globally, 22% of consumers have heard about the metaverse but have not used it in the last six months, while 15% in India know of it but have had no interaction with it in the last six months. But India consumers are participating in metaverse-related interactions in various ways. The survey found that in the last six months:
- 16% have used a virtual reality headset to play games, watch movies or perform work-related activities.
- 16% have interacted with customer service agents virtually.
- 15% have interacted with brands they knew or those providing offers.
- 15% have accessed virtual online healthcare.
- 14% have purchased digital products or non-fungible tokens (NFTs) such as an avatar or digital artwork.
- 16% have purchased products as a result of testing them or browsing stores via metaverse platforms.
- 14% have joined a virtual world – for instance, to experience a retail environment or a concert.
- 17% have purchased physical luxury goods by viewing them digitally first.
Besides, tech enthusiasts have an interest in using chatbots. For retailers, dynamic virtual assistants can enhance customer engagement and boost brand loyalty. Vast amounts of data can be analysed for personalised marketing.

Decision point: Where do consumers buy from?
Food and beverage and clothing top direct to customer (D2C) product categories
Nearly 63% of global consumers – a majority of them millennials – have shifted from traditional marketplaces and middlemen to D2C platforms, such as a brand’s website. In India, 65% of consumers have purchased products directly from a brand’s website, with products related to food and beverage (38%), and clothing and accessories (37%) being the top picks. Electronics (36%), beauty and personal care (35%), and home furnishing (28%) are also popular categories that draw Indian buyers to a brand website.
Direct purchasers are significantly more likely to be millennials and are likely to increase their future spend in several product categories in the next six months, the findings revealed. Globally, clothing and accessories (44%), and electronics (40%) were the top product categories in which people purchased directly from a brand’s website. Those who made such direct purchases were more likely to be millennials and tech enthusiasts.
Product purchase directly from brand's website
Would not consider/have no interest in purchasing directly
Would consider purchasing directly
Have purchased directly
Base: Those who have purchased or are open to purchasing products directly from a brand's website
No interest in subscribing to
Used to subscribe to, but cancelled
Plan to subscribe to /try in future (next 6 months)
Currently subscribe to
More choice and better availability drive direct purchase
About 32% of India respondents in the survey had not made a purchase from a brand website but were open to doing so. For India consumers, the top reasons for purchasing directly or being interested in doing so is greater choice (56%) and better availability of stock (46%). Among other reasons for direct purchase are product authenticity (39%), better service or delivery times (35%), and competitive prices (32%). Brand loyalty was also a factor, with 33% of Indian buyers making a direct purchase from a brand as they always use that brand in that category. Globally, product authenticity (50%) and better choice (42%) are driving traffic to brand websites.
Base: Those who have purchased or are open to purchasing products directly from a brand's website
Subscriptions, once considered a growth driver, now a point of rethink
Clothing and fashion and groceries are the most popular categories for current or planned subscription in India and at a global level. Roughly 12% of subscribers to the top four categories – clothing and fashion, grocery delivery, health products and supplements, and cosmetics – have cancelled subscriptions in the past. In India, 17% of subscribers to these categories have cancelled their subscriptions. Among the top reasons cited for cancellation by India customers were the subscription being too expensive (46%), lack of customisation (42%) and unexpected increase in fees (41%).
No interest in subscribing to
Used to subscribe to, but cancelled
Plan to subscribe to /try in future (next 6 months)
Currently subscribe to
However, consumers intend to try subscription services in the next six months. Millennials and Gen Z are significantly more likely to be planning to sign up, with clothing and fashion (39%), groceries (35%), and health and well-being products (37%) emerging as the top categories for subscriptions in India.
Interestingly, 40% of male respondents from India said they intended to sign up for beauty and cosmetics subscriptions in the near future, a sizable jump from the 19% that currently subscribe to such services. About 31% of women respondents from India said they subscribed to beauty and cosmetic products, while 35% plan to do so in the next six months. Maintaining a consistent lifestyle pattern or routine, such as healthy eating and regular grooming, is the primary motivator for subscribing for 58% of consumers, while personalisation (49%), cost-effectiveness (49%) and convenience (49%) are among the top reasons for choosing to subscribe.

Decision point: Are consumers willing to pay for sustainability?
Consumers ready to pay a premium for conscious choices
In our February 2023 Global Consumer Insights Pulse Survey,6 more than 70% of respondents said that they were willing to pay more for sustainably produced goods ‘to some or to a great extent’. The June survey asked them just how much of a premium they would be willing to pay to follow sustainable practices such as locally produced or sourced food, custom-made or bespoke items, and products manufactured with a lower carbon footprint. The survey found that Millennials and Gen Z, who typically espouse social consciousness and environmental justice, were the most open to spending more for the sake of sustainability.
I would not pay above average price
Up to 5%
6-10%
11-20%
21-30%
More than 30%
Note: ‘Produced with a lower supply chain/carbon footprint’ and ‘Biodegradable and can be disposed of at home’ are new options for Pulse 6.
Roughly 19% of Indian consumers are open to paying up to 20% more to companies with a reputation for ethical practices. For products produced or sourced locally, 24% of India consumers are willing to shell out between 11–20% more than the average price. Moreover, 13% of India consumers are willing to pay 30% higher than the average price for biodegradable products as well as for those made from recycled, sustainable or eco-friendly materials.
Navigating the post-purchase dilemma of reducing returns
Globally, 45% of consumers said they would return fewer items if they had accurate sizing information, and 44% said returns would reduce if product descriptions were more detailed and accurate. India users would return fewer items purchased online if they had visibility of previous customer reviews (47%) and more accurate product descriptions (42%). Other factors that could bring down returns for India consumers include more interactive images of products they were buying (40%), appropriate packaging to avoid damage (38%), knowing that the returned goods would not be sold and be sent to a landfill instead (27%). Only 25% said that a retailer charging them for returns would bring the number down.

Decision point: Where will consumers spend tomorrow?
The previous survey had found that 63% of India consumers were reining in expenditure on non-essential goods and services, while 74% were worried about their finances. A few months on, India consumers seem willing to take on discretionary expenses. Roughly 72% of Indian respondents intend to travel to new destinations in the next six months, with millennials constituting 78% of potential travellers. Indians who travel abroad plan to spend their money on immersion in local culture-related activities such as food markets and dining at top restaurants.
Meanwhile, about 65% of consumers in India, compared with 50% globally, said they planned to increase their online shopping in the next six months with the majority expecting no change to their shopping channel behaviour. In our previous survey, 61% of respondents in India had said they would increase online buying. The current survey found that in India and at a global level, 42% of consumers intended to increase buying from retailers that provide an efficient delivery or collection service. Roughly 29% of consumers in India said they would increase in-store shopping in the coming months.
Shopping online
Buying from retailers that provide an efficient delivery or collection service
Using click and collect services
Shopping in physical stores

Our recommendations
Invest in gen AI-powered chatbots and the metaverse for first-mover advantage
The willingness of India ‘tech embracers’ – who like to buy cutting-edge technology as soon as it is available or to own and try it before most people – to use chatbots and engage with the metaverse can unlock new opportunities for businesses. PwC India’s 26th Annual Global CEO Survey 2023 of top executives in India – which included respondents from the retail and consumer segment – also revealed that businesses are harnessing the potential of the metaverse. Almost 70% of respondents said that they planned to integrate the metaverse into their organisational activities, while 63% of companies that are actively engaged with it emphasised that they would fully embed the metaverse in their organisational activities within a year.7
Retail stores can harness the metaverse to close the ‘immersive experience’ gap.8 At present, popular online shopping platforms are unable to provide such an experience, and this results in customers opting for offline product try-outs followed by an online purchase (showrooming), or drop-offs. With the metaverse, customers will be able to try out products at their homes.
An important aspect of the metaverse is the use of personalised digital avatars. For instance, some luxury brands have started selling virtual handbags and accessories for digital avatars in the metaverse. This concept of virtual bags and other fashion accessories will help in brand positioning because as the metaverse expands and people become more brand conscious with respect to their avatars, it’s likely that the prices of these designer goods will increase. As a result, more luxury brands will start selling virtual clothing and accessories.9 Another way for retailers to use the metaverse is through targeted and segmented marketing. Retailers launching new product lines in the metaverse can gamify their offerings and products.10
Provide enhanced phygital offerings alongside human support
While technological enhancements are key to driving greater adoption of self-checkouts and providing a frictionless retail experience, consumers still seek staff support in-store. About 44% of India consumers said that support staff being readily available to answer checkout queries would encourage them to use self-checkouts more often. While 45% of consumers in India said faster and more responsive touch screen technology would enable them to do self-checkouts regularly, 50% said a variety of payment options would be the motivating factor for them. Businesses can look into offering multiple payment options to accommodate different consumer needs, adopt a user-friendly interface for self-checkouts, and have trained staff to assist consumers in case they run into difficulties.
Synchronise D2C and value-optimise subscription
For businesses trying to enhance D2C, it is imperative to provide the same experience of customer relationship management (CRM), messaging and product merchandising across the brand’s website, app, social handles, third-party marketplaces and physical stores. Moreover, businesses may need to pivot the core of their subscription plan to drive more value.
Optimising subscriptions can provide retailers with predictable revenue streams and scalability, and foster customer loyalty. Offering tiered and customisable plans can meet customer expectations, while providing exceptional customer support can elevate consumer experience.
Place sustainability at the core of communications
COVID-19 brought sustainability into sharp focus and marked a shift to conscious consumerism. Businesses are increasingly adopting sustainable practices such as use of recycled materials and sustainable packaging, and making efforts to reduce their carbon footprint. Retail companies that are committed to their ESG agenda position themselves as agents of change to attract a responsible consumer base.11
To effectively implement ESG-related strategies, organisations need to set up internal processes to ensure that they can conduct business sustainably.12 While it’s vital for businesses to be sustainable, they must also communicate these efforts to consumers. Putting sustainability at the heart of the communication strategy can help businesses align with customer expectations and preferences while building credibility and trust.
Act today to secure a future share of wallet
By influencing consumers at critical decision-making points, businesses can gain a competitive edge. Consumer willingness to increase online shopping underscores the need for businesses to enhance their online presence, and to offer value-added services, such as virtual assistants and personalised recommendations. Retailers offering reliable and quick shipping methods, such as same-day delivery, will stay ahead in the market.
It is also imperative to streamline the returns process and keep it simple to allow customers to shop confidently. Demonstrating commitment to sustainability by reducing packaging waste and using recyclable materials will help meet consumer expectations. Investing in emerging technologies such as the metaverse and generative AI can capture consumer attention with immersive experiences and ultimately help businesses win their loyalty.

About the survey
The Global Consumer Insights Survey is a biannual study that seeks to keep a closer watch on changing consumer trends. For the June 2023 Pulse Survey, we polled 8,975 consumers across 25 countries and territories. A total of 501 respondents were from India.
The consumers were at least 18 years old and were required to have shopped online at least once in the previous year. Of the respondents, 57% identified as male and 43% as female. A majority of the respondents were millennials (56%), followed by Gen Z (29%), Generation X (12%) and baby boomers (3%).
Follow PwC India


