


Download the report
Catalysing value creation in Indian global capability centres
PwC India’s latest research reveals that value creation can be compounded faster when global capability centres (GCCs) are fully aligned with their headquarters. A report by Rajesh Ojha, Dheeraj Gangrade, Manu Dwivedi and Raghav Narsalay.

Key finding 1: Evolving landscape of value creation by GCCs in India
While furthering their commitment to driving cost efficiencies and serving as multi-function Centres of Excellence (CoEs), GCCs are also taking up roles with higher strategic value like new business creator and new tech value incubator, reflecting an overall trend of strategic elevation.
GCCs’ role maturity map: Overall view of both HQ and GCC leadership
Key finding 2: Value erosion caused by lack of alignment between HQ and GCCs
Product and service companies broadly agree on the negative impact of alignment deficits on GCCs’ CAGR for value generation for FY20–24.
For the product group, a larger share of HQ leaders (80%) claimed value-based losses because of lack of complete alignment compared to GCC leaders (69%).
Likewise, in the service group, more HQ leaders (77%) reported misalignment-driven losses than GCC leaders (69%)
Both GCC and HQ leaders acknowledge that closing the projected alignment gaps during FY25–29 can increase value generation by an estimated CAGR of 4%. The fact that the estimated decline in CAGR due to partial alignment was higher – at 7% – could be due to the element of uncertainty invariably associated with the future.
Share of leaders who acknowledged losses due to lack of complete alignment between HQ and GCCs


Key finding 3: Roadmap to unlock value potential by bridging GCC-HQ alignment deficit
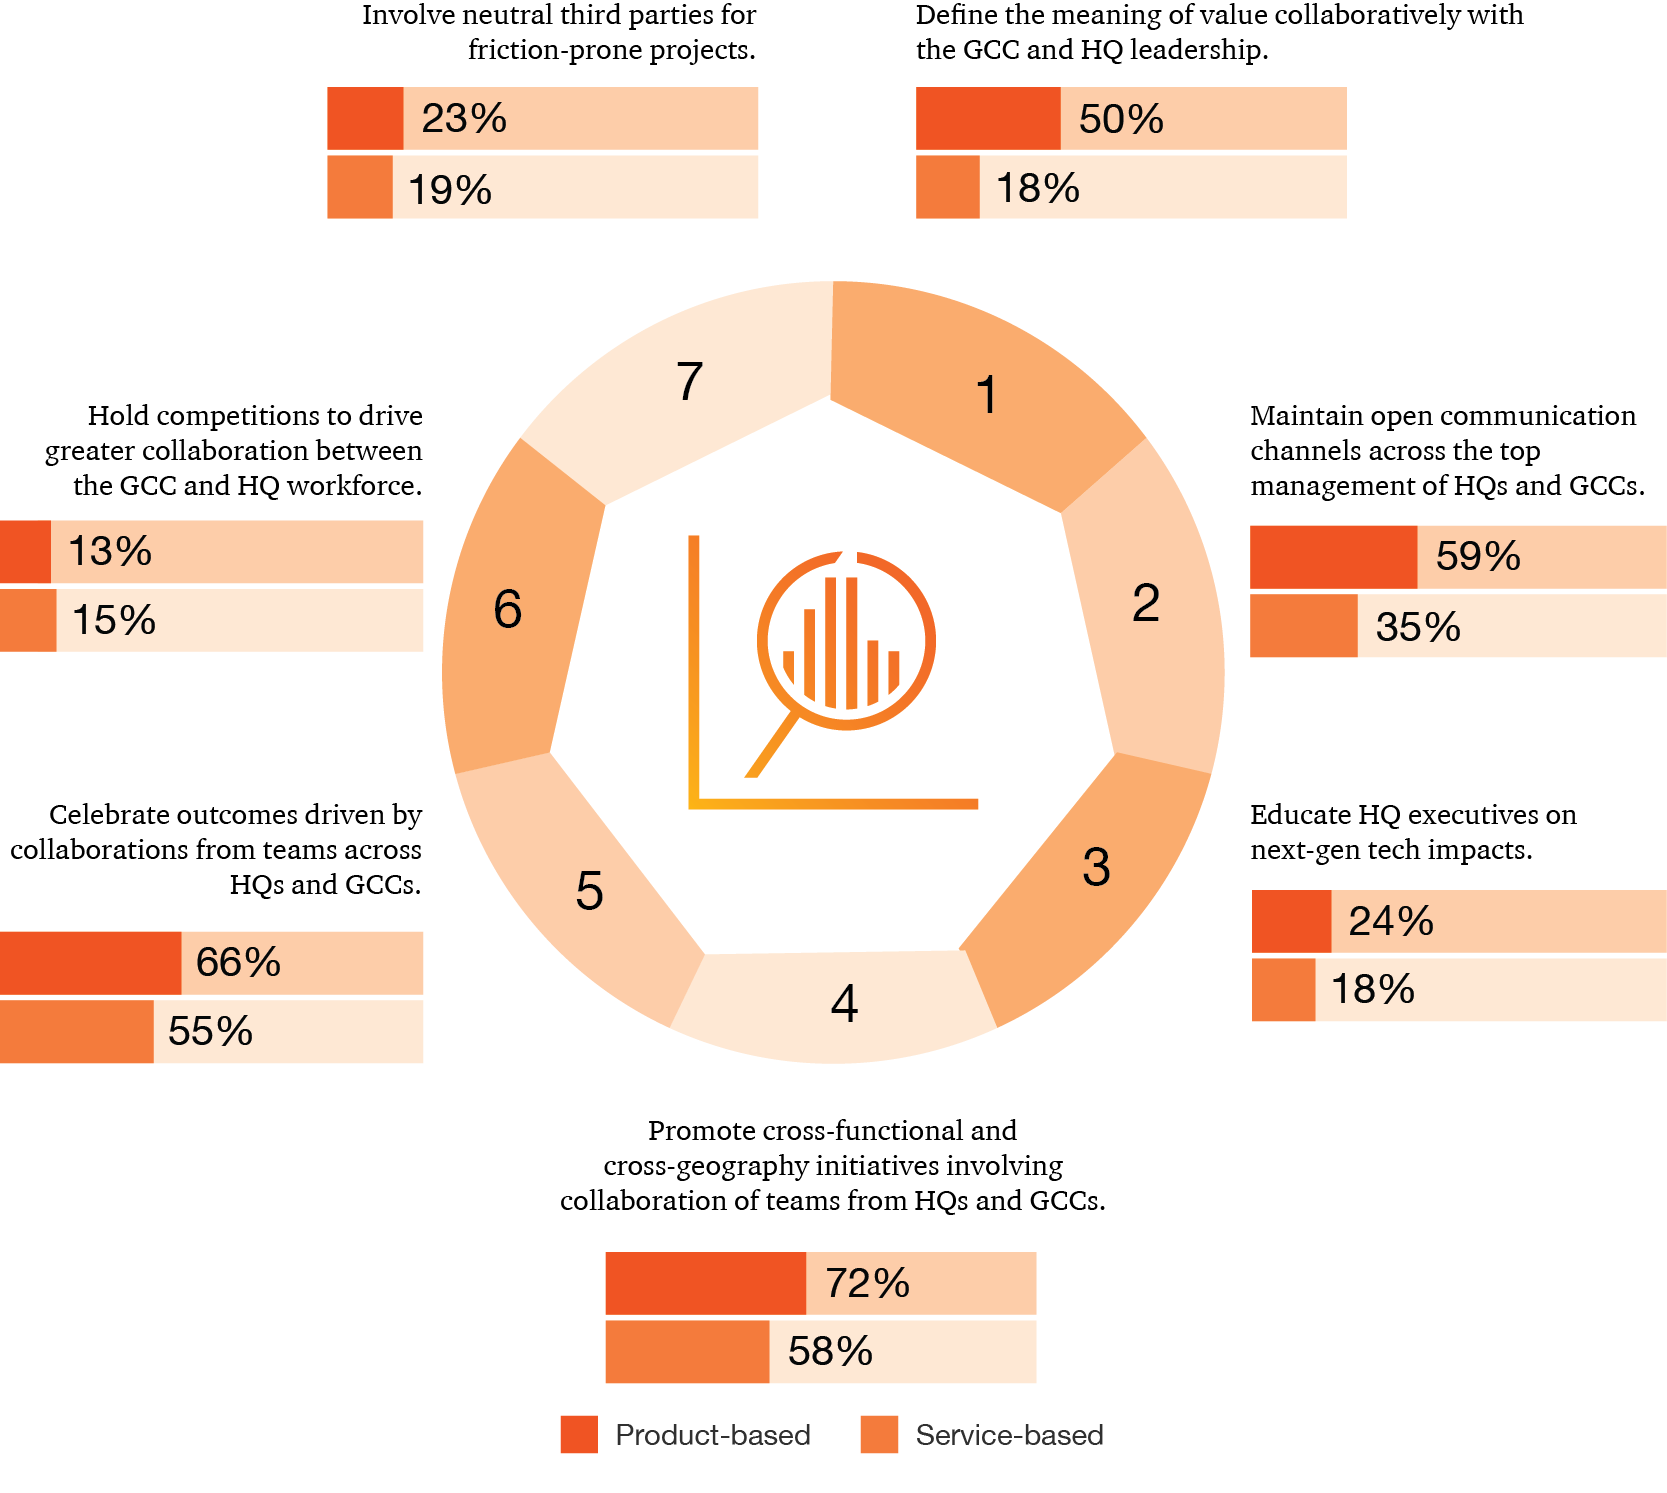
Both GCC and HQ leadership across product and service groups have recommended specific actions to build alignment between HQ and GCCs.
Promoting cross-functional and cross-geography initiatives involving collaboration of teams from GCCs and their HQ has emerged as the top recommendation of both HQ and GCC leaders in the product group. About 81% of HQ and 63% of GCC leaders have extended their support for this solution.
The second preference is accorded to the celebration of outcomes from the collaborative arrangements between the GCC and HQ teams, with 69% of HQ and 63% of GCC leaders showing appreciation for this remedial measure.
Thirdly, both HQ and GCC leaders have vouched for maintaining open communication channels to bridge the alignment deficits as 58% HQ and 60% GCC leaders have backed this solution.
A broader consensus is observed between the product and service groups as the top recommendations of the two groups are uniform and consistent with minor variations in the rankings across HQ and GCCs.
For the service group, the HQ have assigned the highest priority to promoting cross-functional, cross-geography initiatives with 81% leaders lauding the solution. For GCCs, celebration of outcomes driven by HQ-GCC team-level collaboration is the top choice for overcoming the alignment challenges with the support of 57% leaders.
The second choice of both HQ and GCCs is different – 69% of leaders from the global HQ have picked the celebration of collaboration-based outcomes as the second-most effective solution while GCC leaders have shown confidence in promoting cross-functional, cross-geography initiatives among GCCs and HQ.
Both HQ and GCC leadership have agreed on the third preferred solution of maintaining open communication channels between the top management at the HQ and GCCs. About 48% of global HQ and 34% of GCC leaders are appreciative of this solution.
Actions recommended by HQ and GCC leadership to address challenges in alignment

- Evolving GCC landscape in India
- Key actions to unlock significant value
- Roadmap for the next phase of value creation
In terms of maturity, our research indicates that GCCs in India are relatively well established as cost-conscious innovators and multifunctional centres of excellence (CoEs) for their HQs. Product-based 1 companies are ahead in this maturity curve – especially as cost-conscious innovators – compared to service-based 2 companies.
Roles in which GCCs have matured over the years
While GCCs in India have seen a strategic elevation by assuming roles with a higher strategic value such as that of new business creator, new technology value incubator, strategic business partner and ecosystem integrator, these areas are still to mature, as indicated in the figure below. Interestingly, service-based companies are more mature when it comes to the creation of new businesses.
Roles in which GCCs are gradually maturing
Strategy through execution
Looking ahead
In future, India will continue to be a premier destination for setting up GCCs, with global companies committed to maintaining their presence in the country. Less than 25% of business leaders are considering relocating their India GCC operations. Instead, they envision these centres leveraging AI and digital technologies to become global sourcing hubs for IT and business processes.
As nations wait to see how the dynamics around the US reciprocal tariffs play out in the next few months, and brace themselves against global headwinds, we hope this report and the calls to action will help GCCs and their HQs collaborate more strongly towards building more relevant, resilient and responsible value.

Lorem ipsum
Heading
Lorem Ipsum is simply dummy text of the printing and typesetting industry. Lorem Ipsum has been the industry's standard dummy text ever since the 1500s
Lorem ipsum
Heading
Lorem Ipsum is simply dummy text of the printing and typesetting industry. Lorem Ipsum has been the industry's standard dummy text ever since the 1500s
Lorem ipsum
Heading
Lorem Ipsum is simply dummy text of the printing and typesetting industry. Lorem Ipsum has been the industry's standard dummy text ever since the 1500s
Lorem ipsum
Heading
Lorem Ipsum is simply dummy text of the printing and typesetting industry. Lorem Ipsum has been the industry's standard dummy text ever since the 1500s
About the survey
Our survey of 120 C-suite and C-1 level executives from GCCs and another 120 from their respective headquarters within the space of both products and services focused on examining:
value contribution of GCCs perceived through the lens of their respective leaders in India and the HQ during FY20-24.
expectations the leaders of GCCs and their HQ have from their operations in India during FY25-29.
- challenges faced by GCCs and their HQs in aligning with the larger strategic and operational goals.
- business value at stake due to alignment gaps between GCCs and their HQs.
expected actions from GCCs to overcome alignment challenges and boost their strategic positioning, going forward.
Representation across time horizons and revenue streams

C-suite and C-1 level executives covered

The survey covered company representatives across both product and service-based industries

Sources
- Product-based companies are engaged in developing products that cater to the client’s needs on a larger or global scale.
- Service-based companies provide professional services, labour or expertise to clients and customers.
About the survey
PwC India’s survey was conducted over two months in 2024. It surveyed 240 C-suite and C-1 level executives across product-based and service-driven industries to understand the value erosion due to alignment gaps between GCCs and their headquarters. The respondents were primarily CXOs – 120 from GCCs and 120 from their respective HQ. Most companies (45%) had established GCCs between 2010 and 2020. About half of the companies surveyed (46%) have an annual sales turnover of over USD 30 billion.
GCCs surveyed in the research

Follow PwC India


Contact us